Grade 12 Lesson 4: Metrics and Ratios
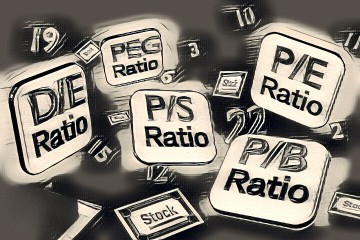
There are several key metrics and ratios to consider when investing in equities. These metrics and ratios can provide valuable insights into a company's financial health, profitability, growth potential, and risk level. Some of the most commonly used metrics and ratios include the P/E ratio, P/B ratio, Dividend Yield, ROE, D/E ratio, EPS, and P/S ratio. In this short lesson, we'll explore some of these key metrics and ratios to consider when investing in equities.
1. Price-to-Earnings (P/E) Ratio
The Price-to-Earnings (P/E) ratio is one of the most commonly used metrics in equity trading and investing. It measures a company's current stock price relative to its earnings per share (EPS). The P/E ratio is calculated by dividing a company's current stock price by its EPS. For example, if a company's stock is trading at $50 per share, and its EPS is $2, then the P/E ratio is 25 ($50/$2).
The P/E ratio provides insights into how much investors are willing to pay for each dollar of a company's earnings. A high P/E ratio indicates that investors are optimistic about the company's future growth potential, while a low P/E ratio suggests that investors are less optimistic.
2. Price-to-Book (P/B) Ratio
The Price-to-Book (P/B) ratio is another important metric used in equity trading and investing. It measures a company's current stock price relative to its book value per share. The book value per share is the company's assets minus its liabilities, divided by the number of outstanding shares.
The P/B ratio is calculated by dividing a company's current stock price by its book value per share. For example, if a company's stock is trading at $50 per share, and its book value per share is $10, then the P/B ratio is 5 ($50/$10).
The P/B ratio provides insights into how much investors are willing to pay for each dollar of a company's assets. A high P/B ratio suggests that investors are willing to pay a premium for the company's assets, while a low P/B ratio suggests that the company's assets are undervalued.
3. Dividend Yield
The Dividend Yield is a ratio that measures the annual dividend payment per share relative to the stock price. It's calculated by dividing the annual dividend payment per share by the stock price. For example, if a company pays an annual dividend of $2 per share, and its stock is trading at $50 per share, then the Dividend Yield is 4% ($2/$50).
The Dividend Yield provides insights into the income-generating potential of a stock. Companies that pay high dividends relative to their stock price may be attractive to income-seeking investors.
4. Return on Equity (ROE)
The Return on Equity (ROE) is a ratio that measures a company's profitability relative to its shareholders' equity. It's calculated by dividing a company's net income by its shareholders' equity. For example, if a company's net income is $10 million, and its shareholders' equity is $100 million, then the ROE is 10% ($10 million/$100 million).
The ROE provides insights into how effectively a company is using its equity to generate profits. Companies with high ROE relative to their peers may be attractive to investors.
5. Debt-to-Equity (D/E) Ratio
The Debt-to-Equity (D/E) ratio measures a company's debt relative to its equity. It's calculated by dividing a company's total debt by its total equity. For example, if a company has $100 million in debt and $500 million in equity, then the D/E ratio is 0.2 ($100 million/$500 million).
The D/E ratio provides insights into a company's financial leverage and its ability to repay its debts. Companies with high D/E ratios may be riskier investments because they have a higher level of debt relative to their equity, which can make them vulnerable during economic downturns or other financial challenges.
6. Earnings per Share (EPS)
Earnings per Share (EPS) is a metric that measures a company's profitability on a per-share basis. It's calculated by dividing a company's net income by the total number of outstanding shares. For example, if a company's net income is $10 million and it has 1 million outstanding shares, then the EPS is $10 per share ($10 million/1 million shares).
EPS provides insights into a company's profitability and growth potential. Companies with high EPS relative to their peers may be attractive to investors because they are generating more earnings per share.
7. Price-to-Sales (P/S) Ratio
The Price-to-Sales (P/S) ratio measures a company's current stock price relative to its revenue per share. It's calculated by dividing a company's current stock price by its revenue per share. For example, if a company's stock is trading at $50 per share, and its revenue per share is $5, then the P/S ratio is 10 ($50/$5).
The P/S ratio provides insights into how much investors are willing to pay for each dollar of a company's revenue. A high P/S ratio suggests that investors are optimistic about the company's future growth potential, while a low P/S ratio suggests that investors are less optimistic.
It's important to note that no single metric or ratio should be used in isolation when making investment decisions. Investors should consider multiple metrics and ratios, as well as other factors such as market trends, industry trends, and company news when making investment decisions. Additionally, investors should always conduct thorough research and analysis before investing in any stocks or other securities.

@ayuecosystem #kids #financialliteracy #finance #investing #equities #finance #money #stockmarket #financialmetrics #financialratios #PEratio #PBratio #dividendyield #ROE #DEratio #EPS #PSratio #financialanalysis #investmentdecisions #younginvestors #stockvaluation #stockanalysis